


While there are differing schools of thought when it comes to whether or not a person should pay off a mortgage before the loan term ends, there may be some benefits to making payments on a bi-weekly basis as opposed to monthly basis. What are some of the reasons why it may be beneficial to make two payments a month instead of one? Here are three reasons why you should ditch the monthly fees and make payments once every two weeks.
You’ll Make An Extra Payment Per Year
If you’re looking to pay off your mortgage ahead of schedule, making bi-weekly payments means you’ll make an extra payment every year. Instead of making 12 large payments every year, you’ll make 26 small payments. These 26 small payments would be equal to about 13 large payments.
This is the equivalent of an extra payment per year and 10 extra payments over 10 years. If you have a 30-year mortgage, you could pay it off between two and three years early because you will make your last payment 30 months ahead of schedule.
You’ll Provide Yourself With Financial Flexibility
Making extra payments can provide you with financial flexibility that makes it easier to deal with unexpected expenses or a job loss. As you are making a half-payment every two week, you can make your payments in smaller, more manageable chunks.
It may be a good thing if you are self-employed and may not be sure when a client will pay for services rendered. Additionally, you may have your next payment reduced or advanced if you pay more than you owe in a given month.
You’ll Reduce the Amount of Interest Paid on the Loan
Paying off your mortgage faster reduces the amount of interest that you pay on the loan. Even if you only make one extra payment per year, you could still save thousands of dollars in interest by paying your loan several months or years early.
To determine exactly how much you will save, you can use an amortization table or calculator to see how much interest you pay over the full 30 years as opposed to taking only 27 or 28 years to pay for your home. It is also important to note that making extra payments adds to the equity that you have in the home.
Making two payments instead of one each month may help you achieve financial flexibility while building equity in your home. By paying off your mortgage as soon as possible, it may enable you to put more money into a savings or retirement account. Contact a mortgage professional for more information about whether bi-weekly payments are right for you.
Steph Noble
http://stephnoblemortgageblog.com
When a rental property that is occupied by a tenant is sold to a new owner there are many details that require diligent attention. One of these areas is the utility billing and interim billing. Interim billing is one of the first things that you would want to cancel because an Owner doesn’t want to accidently pay for bill that isn’t their responsibility. This ensures proper and accurate billing. As a general rule, the tenant is responsible for all utilities for a single family home. In this case nothing changes if ownership changes and the tenant stays in place. If the house is located in a city where the population is over 100K, the owner is responsible for the garbage service. In this case, the garbage bill is changed to the name of the new Owner.
As a local property management company, we have the garbage bills mailed to our office and we pay it out of the rental income on behalf of the owner. That way the charge will be reflected on the monthly statement. This is important because this expense is a tax write-off for the home owner. If the new Owner is going to move into the property, and the tenant is going to move out, then all utilities will be a prorated amount based upon the move out date of the tenant. If the tenant moves out on the 18th of the month, then they are responsible for 18 days’ worth of electricity, water, sewer, garbage and natural gas. As the property management company for the house, we track this and make sure all these charges are distributed correctly.
We also manage condominiums and often times the owner/investor will pay the Condo Association fees that include water, sewer and garbage. These charges are also a tax write off and can be tracked for the year. Although none of this is difficult to manage, it does need to be watched carefully so all parties involved pay only their share. This careful attention to detail is what we do here at Rappold Property Management.
Rappold Property Management, LLC
1125 SE Madison Street, suite #201
Portland, OR 97214
Phone: 503-232-5990
Fax: 503-232-1462
As of March 17 2014 there were about 7,821 single family and condo homes listed for sale in Portland Oregon. The median asking price of these homes was approximately $299,000. Since this time last year, the inventory of homes for sale has decreased by 2.2% and the median price has increased by 10.8%.
| March 17, 2014 | Month/Month | Year/Year | |
|---|---|---|---|
| Median Asking Price | $299,000 | +3.3% | +10.8% |
| Home Listings/Inventory | 7,821 | -0.7% | -2.2% |
| Date | Single Family & Condo Inventory |
25th Percentile Asking Price |
Median Asking Price |
75th Percentile Asking Price |
|---|---|---|---|---|
| 03/17/2014 | 7,821 | $215,000 | $299,000 | $465,000 |
| 03/10/2014 | 7,819 | $214,900 | $297,565 | $460,000 |
| 03/03/2014 | 7,870 | $214,900 | $294,900 | $450,000 |
| 02/24/2014 | 7,818 | $214,500 | $289,900 | $450,000 |
| 02/17/2014 | 7,874 | $213,000 | $289,500 | $449,900 |
The median asking price for homes in Portland peaked in April 2007 at $354,740 and is now $57,585 (16.2%) lower. From a low of $239,125 in February 2011, the median asking price in Portland has increased by $58,030 (24.3%).
Housing inventory in Portland, which is typically highest in the spring/summer and lowest in the fall/winter, peaked at 23,354 in July 2008. The lowest housing inventory level seen was 7,810 in February 2014.
| Date | Single Family & Condo Inventory |
25th Percentile Asking Price |
Median Asking Price |
75th Percentile Asking Price |
|---|---|---|---|---|
| March 2014 | 7,837 | $214,933 | $297,155 | $458,333 |
| February 2014 | 7,810 | $211,875 | $288,950 | $449,450 |
| January 2014 | 7,857 | $209,225 | $286,975 | $444,025 |
| December 2013 | 8,570 | $209,920 | $289,144 | $449,520 |
| November 2013 | 9,392 | $210,177 | $289,350 | $449,900 |
| October 2013 | 9,929 | $212,815 | $294,463 | $450,000 |
| September 2013 | 10,167 | $211,790 | $296,780 | $451,980 |
| August 2013 | 10,119 | $210,875 | $297,000 | $450,000 |
| July 2013 | 9,490 | $206,640 | $296,560 | $450,000 |
| June 2013 | 8,858 | $199,688 | $288,694 | $449,975 |
| May 2013 | 8,527 | $194,888 | $281,850 | $446,900 |
| April 2013 | 8,075 | $186,800 | $274,540 | $439,060 |
| March 2013 | 7,969 | $182,923 | $267,425 | $427,213 |
| February 2013 | 7,981 | $179,900 | $262,450 | $419,731 |
| January 2013 | 8,250 | $179,075 | $259,217 | $404,725 |
| December 2012 | 8,627 | $178,900 | $259,720 | $405,750 |
| November 2012 | 9,408 | $179,675 | $260,950 | $408,963 |
| October 2012 | 10,259 | $179,900 | $267,160 | $418,600 |
| September 2012 | 10,828 | $179,900 | $268,975 | $418,450 |
| August 2012 | 11,102 | $179,675 | $268,725 | $418,500 |
| July 2012 | 11,140 | $177,600 | $266,598 | $411,651 |
| June 2012 | 11,362 | $174,825 | $259,675 | $399,950 |
| May 2012 | 11,227 | $169,713 | $252,463 | $399,450 |
| April 2012 | 10,820 | $169,160 | $249,910 | $397,940 |
| March 2012 | 9,683 | $174,450 | $259,450 | $406,225 |
| February 2012 | 10,549 | $169,225 | $248,250 | $388,025 |
| January 2012 | 10,833 | $169,080 | $246,960 | $381,960 |
| December 2011 | 11,461 | $169,925 | $248,375 | $385,675 |
| November 2011 | 12,018 | $174,750 | $250,972 | $397,425 |
| October 2011 | 12,846 | $179,530 | $258,720 | $399,900 |
| September 2011 | 13,509 | $179,939 | $259,900 | $399,900 |
| August 2011 | 14,672 | $179,360 | $256,590 | $395,540 |
| July 2011 | 14,772 | $178,150 | $253,188 | $389,225 |
| June 2011 | 14,762 | $176,475 | $250,970 | $386,970 |
| May 2011 | 14,582 | $173,184 | $249,160 | $375,780 |
| April 2011 | 14,748 | $169,950 | $242,400 | $364,975 |
| March 2011 | 15,458 | $169,800 | $239,675 | $359,575 |
| February 2011 | 15,531 | $169,675 | $239,125 | $354,725 |
| January 2011 | 15,001 | $170,760 | $239,158 | $356,380 |
| December 2010 | 16,118 | $176,200 | $242,700 | $363,363 |
| November 2010 | 17,018 | $180,160 | $249,330 | $373,780 |
| October 2010 | 17,614 | $184,975 | $253,375 | $381,975 |
| September 2010 | 18,282 | $189,100 | $258,925 | $390,950 |
| August 2010 | 18,579 | $190,940 | $261,150 | $397,160 |
| July 2010 | 18,160 | $195,163 | $267,475 | $399,000 |
| June 2010 | 17,488 | $196,853 | $268,875 | $399,800 |
| May 2010 | 17,035 | $198,880 | $269,620 | $399,818 |
| April 2010 | 17,279 | $198,000 | $266,750 | $392,500 |
| March 2010 | 16,495 | $195,600 | $264,460 | $393,960 |
| February 2010 | 15,382 | $194,938 | $264,450 | $395,198 |
| January 2010 | 14,895 | $197,819 | $267,425 | $399,225 |
| December 2009 | 15,329 | $199,897 | $272,038 | $402,212 |
| November 2009 | 15,902 | $202,750 | $277,760 | $417,780 |
| October 2009 | 16,573 | $209,675 | $283,646 | $428,225 |
| September 2009 | 17,165 | $210,000 | $289,475 | $436,100 |
| August 2009 | 17,595 | $211,760 | $292,880 | $444,320 |
| July 2009 | 17,819 | $212,950 | $294,950 | $449,000 |
| June 2009 | 17,870 | $213,460 | $294,920 | $449,100 |
| May 2009 | 17,713 | $211,475 | $293,291 | $445,250 |
| April 2009 | 17,978 | $212,525 | $289,925 | $444,725 |
| March 2009 | 18,506 | $214,153 | $289,930 | $443,360 |
| February 2009 | 18,449 | $216,014 | $293,968 | $448,125 |
| January 2009 | 18,872 | $219,952 | $297,855 | $452,809 |
| December 2008 | 19,842 | $223,220 | $302,773 | $458,508 |
| November 2008 | 20,983 | $226,382 | $307,532 | $464,024 |
| October 2008 | 22,086 | $229,650 | $312,450 | $469,724 |
| September 2008 | 22,973 | $233,730 | $319,580 | $474,990 |
| August 2008 | 23,314 | $235,200 | $322,000 | $475,725 |
| July 2008 | 23,354 | $236,074 | $324,550 | $475,000 |
| June 2008 | 22,657 | $239,150 | $324,920 | $479,459 |
| May 2008 | 21,505 | $239,900 | $325,000 | $480,947 |
| April 2008 | 20,669 | $239,900 | $324,937 | $479,912 |
| March 2008 | 19,381 | $241,300 | $324,860 | $485,960 |
| February 2008 | 18,409 | $240,485 | $324,925 | $479,912 |
| January 2008 | 17,659 | $243,500 | $324,962 | $481,765 |
| December 2007 | 18,584 | $245,120 | $327,975 | $489,355 |
| November 2007 | 19,926 | $248,665 | $330,475 | $486,425 |
| October 2007 | 20,762 | $249,950 | $337,260 | $493,980 |
| September 2007 | 20,656 | $253,425 | $339,900 | $497,749 |
| August 2007 | 19,837 | $257,712 | $342,975 | $499,124 |
| July 2007 | 18,710 | $261,120 | $349,120 | $499,930 |
| June 2007 | 17,670 | $264,282 | $349,950 | $507,949 |
| May 2007 | 16,386 | $264,900 | $350,975 | $512,662 |
| April 2007 | 15,059 | $264,900 | $354,740 | $517,740 |
| March 2007 | 13,897 | $264,450 | $353,850 | $523,425 |
| February 2007 | 13,814 | $258,517 | $349,800 | $516,750 |
| January 2007 | 13,726 | $255,810 | $349,637 | $507,441 |
| December 2006 | 14,746 | $257,149 | $348,246 | $499,949 |
| November 2006 | 15,671 | $258,837 | $348,750 | $499,900 |
| October 2006 | 16,027 | $259,640 | $348,834 | $499,900 |
| September 2006 | 15,239 | $261,098 | $349,675 | $499,937 |
| August 2006 | 14,029 | $264,925 | $350,737 | $518,587 |
| July 2006 | 12,864 | $264,920 | $350,470 | $525,980 |
| June 2006 | 11,261 | $264,925 | $349,975 | $530,937 |
| May 2006 | 9,804 | $262,340 | $350,940 | $532,360 |
| April 2006 | 8,701 | $256,433 | $346,433 | $526,224 |
Data on deptofnumbers.com is for informational purposes only. No warranty or guarantee of accuracy is offered or implied. Contact ben@deptofnumbers.com (or @deptofnumbers on Twitter) if you have any questions, comments or suggestions. Privacy policy.
The ability to smoke in public and at apartment communities has been under attack for years. But what about rental homes? Often times an owner plans to rent their home for only a year or two. Certainly the owner does not want to receive the house back with the smell of cigarette smoke still lingering in the house. Even if the renter was a model tenant in all other respects, cigarette smoke can be very destructive. Smoking turns walls yellow (new paint job $1,200), it destroys carpets ($1,500), and it requires a deeper cleaning, perhaps with a deionizer ($500). The cost of all this stress…priceless.
The best approach? In all of our homes we have a no smoking policy. However, we do allow the renter to smoke outside, perhaps on the porch or deck. However, this issue can be a hard one to enforce. What if it’s cold outside? Who wants to stand outside when it’s only 35 degrees? The renter is easily tempted to stand inside the house or close to an open window and light up. Inevitably, smoke gets in the house and the home owner smells the evidence. A good suggestion is to do an inspection within the first month or two of a new lease if you know the renter smokes. Catch the problem early. Then do another inspection a few months later to make sure. If you detect smoke after the tenant moves out, a landlord can charge the tenant for the remediation of the smell. But this can be a tricky proposition. It is always best to be pro-active and keep this issue from becoming a possible expense. It is less ideal to react and pursue a vacating tenant for money.
You can always call Rappold Property Management with questions about your single family home investment.
Troy Rappold
Rappold Property Management, LLC
1125 SE Madison Street, suite #201
Portland, OR 97214
Phone: 503-232-5990
Fax: 503-232-1462

From crunched-up leaves stuck to bottoms of shoes to bulky coats shed as soon as kids walk through the door, mudrooms are ideal for keeping outdoor dirt, wet clothing and outerwear from being strewn throughout your home.
Mudrooms not only keep the rest of your house clean, but they also designate a spot for those last-minute grabs, such as coats, umbrellas and purses, when you’re running out the door.
These rooms are great catchalls. However, an organized mudroom can make your life and those hectic mornings much less stressful. Below are smart tips for getting your mudroom ready this fall.
1. Put In Seating
After shedding outer layers, the next thing anyone wants to do after coming inside on a cold, wet day is to take off their mucky shoes. So make sure there is a built-in bench or convenient chair for people to sit down and tend to their tootsies. Whether taking off or putting on shoes, it makes life a little more comfortable.
2. Install A Sink
A mudroom is supposed to be the catchall for everything dirty from the outdoors. With this in mind, a sink for washing off the grime and mud makes sense. Then you can clean your clothing in the contained space without having to haul them to the kitchen sink or laundry room.
3. Create Cubbies
Even though this space is designated as a drop-off point before entering the main living space, you don’t want everything just thrown into one big confusing pile. Create individual cubbies for every person in your household. Each cubby should contain a shelf for purses and backpacks, hooks for coats and a low place for shoes.
4. Splurge On A Boot Warmer
While electric boot warmers can be a little expensive, you will definitely think it’s worth the money when it’s freezing outside and your shoes are damp. Electric boot warmers heat your shoes on pegs and dry them out at the same time. They also work well on gloves.
Fall is a mudroom’s busy season; so get it in shape with the tips above. With all the coats hanging on their hooks, shoes in their cubbies and dirt contained to this designated space, your life will be a little more organized and much less stressful!
Steph Noble
Northwest Mortgage Group
(503) 528-9800
http://www.stephnoble.com
http://www.nwmortgagegoup.com
| June 03, 2013 | Month/Month | Year/Year | |
|---|---|---|---|
| Median Asking Price | $285,077 | +1.8% | +10.1% |
| Home Listings/Inventory | 8,714 | +3.5% | -23.4% |
| Date | Single Family & Condo Inventory |
25th Percentile Asking Price |
Median Asking Price |
75th Percentile Asking Price |
|---|---|---|---|---|
| 06/03/2013 | 8,714 | $199,000 | $285,077 | $449,900 |
| 05/27/2013 | 8,631 | $197,700 | $285,000 | $449,000 |
| 05/20/2013 | 8,597 | $195,000 | $282,500 | $441,100 |
| 05/13/2013 | 8,460 | $194,950 | $280,000 | $448,500 |
| 05/06/2013 | 8,420 | $191,900 | $279,900 | $449,000 |
The median asking price for homes in Portland peaked in April 2007 at $354,740 and is now $69,663 (19.6%) lower. From a low of $239,125 in February 2011, the median asking price in Portland has increased by $45,952 (19.2%).
Housing inventory in Portland, which is typically highest in the spring/summer and lowest in the fall/winter, peaked at 23,354 in July 2008. The lowest housing inventory level seen was 7,969 in March 2013.
| Date | Single Family & Condo Inventory |
25th Percentile Asking Price |
Median Asking Price |
75th Percentile Asking Price |
|---|---|---|---|---|
| June 2013 | 8,714 | $199,000 | $285,077 | $449,900 |
| May 2013 | 8,527 | $194,888 | $281,850 | $446,900 |
| April 2013 | 8,075 | $186,800 | $274,540 | $439,060 |
| March 2013 | 7,969 | $182,923 | $267,425 | $427,213 |
| February 2013 | 7,981 | $179,900 | $262,450 | $419,731 |
| January 2013 | 8,250 | $179,075 | $259,217 | $404,725 |
| December 2012 | 8,627 | $178,900 | $259,720 | $405,750 |
| November 2012 | 9,408 | $179,675 | $260,950 | $408,963 |
| October 2012 | 10,259 | $179,900 | $267,160 | $418,600 |
| September 2012 | 10,828 | $179,900 | $268,975 | $418,450 |
| August 2012 | 11,102 | $179,675 | $268,725 | $418,500 |
| July 2012 | 11,140 | $177,600 | $266,598 | $411,651 |
| June 2012 | 11,362 | $174,825 | $259,675 | $399,950 |
| May 2012 | 11,227 | $169,713 | $252,463 | $399,450 |
| April 2012 | 10,820 | $169,160 | $249,910 | $397,940 |
| March 2012 | 9,683 | $174,450 | $259,450 | $406,225 |
| February 2012 | 10,549 | $169,225 | $248,250 | $388,025 |
| January 2012 | 10,833 | $169,080 | $246,960 | $381,960 |
| December 2011 | 11,461 | $169,925 | $248,375 | $385,675 |
| November 2011 | 12,018 | $174,750 | $250,972 | $397,425 |
| October 2011 | 12,846 | $179,530 | $258,720 | $399,900 |
| September 2011 | 13,509 | $179,939 | $259,900 | $399,900 |
| August 2011 | 14,672 | $179,360 | $256,590 | $395,540 |
| July 2011 | 14,772 | $178,150 | $253,188 | $389,225 |
| June 2011 | 14,762 | $176,475 | $250,970 | $386,970 |
| May 2011 | 14,582 | $173,184 | $249,160 | $375,780 |
| April 2011 | 14,748 | $169,950 | $242,400 | $364,975 |
| March 2011 | 15,458 | $169,800 | $239,675 | $359,575 |
| February 2011 | 15,531 | $169,675 | $239,125 | $354,725 |
| January 2011 | 15,001 | $170,760 | $239,158 | $356,380 |
| December 2010 | 16,118 | $176,200 | $242,700 | $363,363 |
| November 2010 | 17,018 | $180,160 | $249,330 | $373,780 |
| October 2010 | 17,614 | $184,975 | $253,375 | $381,975 |
| September 2010 | 18,282 | $189,100 | $258,925 | $390,950 |
| August 2010 | 18,579 | $190,940 | $261,150 | $397,160 |
| July 2010 | 18,160 | $195,163 | $267,475 | $399,000 |
| June 2010 | 17,488 | $196,853 | $268,875 | $399,800 |
| May 2010 | 17,035 | $198,880 | $269,620 | $399,818 |
| April 2010 | 17,279 | $198,000 | $266,750 | $392,500 |
| March 2010 | 16,495 | $195,600 | $264,460 | $393,960 |
| February 2010 | 15,382 | $194,938 | $264,450 | $395,198 |
| January 2010 | 14,895 | $197,819 | $267,425 | $399,225 |
| December 2009 | 15,329 | $199,897 | $272,038 | $402,212 |
| November 2009 | 15,902 | $202,750 | $277,760 | $417,780 |
| October 2009 | 16,573 | $209,675 | $283,646 | $428,225 |
| September 2009 | 17,165 | $210,000 | $289,475 | $436,100 |
| August 2009 | 17,595 | $211,760 | $292,880 | $444,320 |
| July 2009 | 17,819 | $212,950 | $294,950 | $449,000 |
| June 2009 | 17,870 | $213,460 | $294,920 | $449,100 |
| May 2009 | 17,713 | $211,475 | $293,291 | $445,250 |
| April 2009 | 17,978 | $212,525 | $289,925 | $444,725 |
| March 2009 | 18,506 | $214,153 | $289,930 | $443,360 |
| February 2009 | 18,449 | $216,014 | $293,968 | $448,125 |
| January 2009 | 18,872 | $219,952 | $297,855 | $452,809 |
| December 2008 | 19,842 | $223,220 | $302,773 | $458,508 |
| November 2008 | 20,983 | $226,382 | $307,532 | $464,024 |
| October 2008 | 22,086 | $229,650 | $312,450 | $469,724 |
| September 2008 | 22,973 | $233,730 | $319,580 | $474,990 |
| August 2008 | 23,314 | $235,200 | $322,000 | $475,725 |
| July 2008 | 23,354 | $236,074 | $324,550 | $475,000 |
| June 2008 | 22,657 | $239,150 | $324,920 | $479,459 |
| May 2008 | 21,505 | $239,900 | $325,000 | $480,947 |
| April 2008 | 20,669 | $239,900 | $324,937 | $479,912 |
| March 2008 | 19,381 | $241,300 | $324,860 | $485,960 |
| February 2008 | 18,409 | $240,485 | $324,925 | $479,912 |
| January 2008 | 17,659 | $243,500 | $324,962 | $481,765 |
| December 2007 | 18,584 | $245,120 | $327,975 | $489,355 |
| November 2007 | 19,926 | $248,665 | $330,475 | $486,425 |
| October 2007 | 20,762 | $249,950 | $337,260 | $493,980 |
| September 2007 | 20,656 | $253,425 | $339,900 | $497,749 |
| August 2007 | 19,837 | $257,712 | $342,975 | $499,124 |
| July 2007 | 18,710 | $261,120 | $349,120 | $499,930 |
| June 2007 | 17,670 | $264,282 | $349,950 | $507,949 |
| May 2007 | 16,386 | $264,900 | $350,975 | $512,662 |
| April 2007 | 15,059 | $264,900 | $354,740 | $517,740 |
| March 2007 | 13,897 | $264,450 | $353,850 | $523,425 |
| February 2007 | 13,814 | $258,517 | $349,800 | $516,750 |
| January 2007 | 13,726 | $255,810 | $349,637 | $507,441 |
| December 2006 | 14,746 | $257,149 | $348,246 | $499,949 |
| November 2006 | 15,671 | $258,837 | $348,750 | $499,900 |
| October 2006 | 16,027 | $259,640 | $348,834 | $499,900 |
| September 2006 | 15,239 | $261,098 | $349,675 | $499,937 |
| August 2006 | 14,029 | $264,925 | $350,737 | $518,587 |
| July 2006 | 12,864 | $264,920 | $350,470 | $525,980 |
| June 2006 | 11,261 | $264,925 | $349,975 | $530,937 |
| May 2006 | 9,804 | $262,340 | $350,940 | $532,360 |
| April 2006 | 8,701 | $256,433 | $346,433 | $526,224 |
The Department of Numbers contextualizes public data so that individuals can form independent opinions on everyday social and economic matters.

[QE] is definitely a pretty roundabout way of driving money into the real economy. Instead of putting the money directly to work, pay money to people who already have assets even more than their assets are currently trading for, in the hope that they’ll put at least some of the money to work.
In a sidenote he addresses “helicopter money” AKA “QE for the people.”
QE involves paying over a $ (or Pounds, or Yen) amount in return for an existing asset. This is a crucial feature, and accounts for many of the drawbacks — in particular that the policy benefits above all existing holders of assets. In theory, just handing money to everybody in the country is a more effective and equal way of acheiving its aims. But you don’t have to be a hard-money Bundesbanker to be at least a little uncomfortable with where this might end up
QE via asset purchases does strike me as a very roundabout way of addressing a demand shortfall in a substantially consumer driven economy. But as the above post suggests, nothing else may be politically viable.
…
Institutional home buying fatigue?
We just don’t see the returns there that are adequate to incentivize us to continue to invest, [Bruce] Rose, 55, chief executive officer of Carrington Holding Co. LLC, said in an interview at his Aliso Viejo, California office. There’s a lot of — bluntly — stupid money that jumped into the trade without any infrastructure, without any real capabilities and a kind of build-it-as-you-go mentality that we think is somewhat irresponsible.
#2013-05-29 [ via ]
…
Housing inventory trajectory for 2013.
I forgot to point out this post by Calculated Risk earlier this week. He’s using my housing inventory data to chart the trajectory of listings coming online this year. Inventory has come way down over the past couple of years and the big question is whether this winter will mark a bottom. If a lot of homes go on the market this spring, it probably indicates a bottom.
…
Steve Randy Waldman: I think the behavior of real interest rates is the empirical fingerprint of the effect of inequality on demand.
Where the missing demand comes from:
Household borrowing represents, in a very direct sense, a redistribution of purchasing power from savers to borrowers. So if we worry that oversaving by the rich may lead to an insufficiency of purchases [by poorer households], household borrowing is a natural place to look for a remedy. Sure enough, we find that beginning in the early 1980s, household borrowing began a secular rise that continued until the financial crisis.
Why that’s a problem:
Suppose that the mechanism that reconciles inequality and adequate demand is household borrowing. Is that sustainable? After all, poorer households would have to borrow new purchasing power in every period in order to support demand for as long as inequality remains high.
How it messes with the role of banks in the economy:
We very explicitly ask banks to intermediate the deficit in demand, exhorting them to lend lend lend for macroeconomic reasons that are indifferent to microeconomic evaluations of solvency. We can have a banking system that performs the information work of credit analysis and lends appropriately, or we can have a banking system that overcomes deficiencies in demand. We cannot have both when great volumes of lending are continually required for structural reasons.
The elegance and insight density of this post is off the charts!
Data on deptofnumbers.com is for informational purposes only. No warranty or guarantee of accuracy is offered or implied. Contact ben@deptofnumbers.com (or @deptofnumbers on Twitter) if you have any questions, comments or suggestions.
Department of Numbers
http://www.deptofnumbers.com/
As of April 08 2013 there were about 8,039 single family and condo homes listed for sale in Portland Oregon. The median asking price of these homes was approximately $274,000. Since this time last year, the inventory of homes for sale has decreased by 24.4% and the median price has increased by 9.6%.
| April 08, 2013 | Month/Month | Year/Year | |
|---|---|---|---|
| Median Asking Price | $274,000 | +3.4% | +9.6% |
| Home Listings/Inventory | 8,039 | +0.8% | -24.4% |
| Date | Single Family & Condo Inventory |
25th Percentile Asking Price |
Median Asking Price |
75th Percentile Asking Price |
|---|---|---|---|---|
| 04/08/2013 | 8,039 | $185,000 | $274,000 | $439,000 |
| 04/01/2013 | 7,836 | $185,000 | $269,900 | $429,900 |
| 03/25/2013 | 7,975 | $184,990 | $269,900 | $429,950 |
| 03/18/2013 | 7,998 | $184,900 | $269,900 | $429,000 |
| 03/11/2013 | 7,979 | $181,900 | $265,000 | $425,000 |
The median asking price for homes in Portland peaked in April 2007 at $354,740 and is now $82,790 (23.3%) lower. From a low of $239,125 in February 2011, the median asking price in Portland has increased by $32,825 (13.7%).
Housing inventory in Portland, which is typically highest in the spring/summer and lowest in the fall/winter, peaked at 23,354 in July 2008. The lowest housing inventory level seen was 7,938 in April 2013.
| Date | Single Family & Condo Inventory |
25th Percentile Asking Price |
Median Asking Price |
75th Percentile Asking Price |
|---|---|---|---|---|
| April 2013 | 7,938 | $185,000 | $271,950 | $434,450 |
| March 2013 | 7,969 | $182,923 | $267,425 | $427,213 |
| February 2013 | 7,981 | $179,900 | $262,450 | $419,731 |
| January 2013 | 8,250 | $179,075 | $259,217 | $404,725 |
| December 2012 | 8,627 | $178,900 | $259,720 | $405,750 |
| November 2012 | 9,408 | $179,675 | $260,950 | $408,963 |
| October 2012 | 10,259 | $179,900 | $267,160 | $418,600 |
| September 2012 | 10,828 | $179,900 | $268,975 | $418,450 |
| August 2012 | 11,102 | $179,675 | $268,725 | $418,500 |
| July 2012 | 11,140 | $177,600 | $266,598 | $411,651 |
| June 2012 | 11,362 | $174,825 | $259,675 | $399,950 |
| May 2012 | 11,227 | $169,713 | $252,463 | $399,450 |
| April 2012 | 10,820 | $169,160 | $249,910 | $397,940 |
| March 2012 | 9,683 | $174,450 | $259,450 | $406,225 |
| February 2012 | 10,549 | $169,225 | $248,250 | $388,025 |
| January 2012 | 10,833 | $169,080 | $246,960 | $381,960 |
| December 2011 | 11,461 | $169,925 | $248,375 | $385,675 |
| November 2011 | 12,018 | $174,750 | $250,972 | $397,425 |
| October 2011 | 12,846 | $179,530 | $258,720 | $399,900 |
| September 2011 | 13,509 | $179,939 | $259,900 | $399,900 |
| August 2011 | 14,672 | $179,360 | $256,590 | $395,540 |
| July 2011 | 14,772 | $178,150 | $253,188 | $389,225 |
| June 2011 | 14,762 | $176,475 | $250,970 | $386,970 |
| May 2011 | 14,582 | $173,184 | $249,160 | $375,780 |
| April 2011 | 14,748 | $169,950 | $242,400 | $364,975 |
| March 2011 | 15,458 | $169,800 | $239,675 | $359,575 |
| February 2011 | 15,531 | $169,675 | $239,125 | $354,725 |
| January 2011 | 15,001 | $170,760 | $239,158 | $356,380 |
| December 2010 | 16,118 | $176,200 | $242,700 | $363,363 |
| November 2010 | 17,018 | $180,160 | $249,330 | $373,780 |
| October 2010 | 17,614 | $184,975 | $253,375 | $381,975 |
| September 2010 | 18,282 | $189,100 | $258,925 | $390,950 |
| August 2010 | 18,579 | $190,940 | $261,150 | $397,160 |
| July 2010 | 18,160 | $195,163 | $267,475 | $399,000 |
| June 2010 | 17,488 | $196,853 | $268,875 | $399,800 |
| May 2010 | 17,035 | $198,880 | $269,620 | $399,818 |
| April 2010 | 17,279 | $198,000 | $266,750 | $392,500 |
| March 2010 | 16,495 | $195,600 | $264,460 | $393,960 |
| February 2010 | 15,382 | $194,938 | $264,450 | $395,198 |
| January 2010 | 14,895 | $197,819 | $267,425 | $399,225 |
| December 2009 | 15,329 | $199,897 | $272,038 | $402,212 |
| November 2009 | 15,902 | $202,750 | $277,760 | $417,780 |
| October 2009 | 16,573 | $209,675 | $283,646 | $428,225 |
| September 2009 | 17,165 | $210,000 | $289,475 | $436,100 |
| August 2009 | 17,595 | $211,760 | $292,880 | $444,320 |
| July 2009 | 17,819 | $212,950 | $294,950 | $449,000 |
| June 2009 | 17,870 | $213,460 | $294,920 | $449,100 |
| May 2009 | 17,713 | $211,475 | $293,291 | $445,250 |
| April 2009 | 17,978 | $212,525 | $289,925 | $444,725 |
| March 2009 | 18,506 | $214,153 | $289,930 | $443,360 |
| February 2009 | 18,449 | $216,014 | $293,968 | $448,125 |
| January 2009 | 18,872 | $219,952 | $297,855 | $452,809 |
| December 2008 | 19,842 | $223,220 | $302,773 | $458,508 |
| November 2008 | 20,983 | $226,382 | $307,532 | $464,024 |
| October 2008 | 22,086 | $229,650 | $312,450 | $469,724 |
| September 2008 | 22,973 | $233,730 | $319,580 | $474,990 |
| August 2008 | 23,314 | $235,200 | $322,000 | $475,725 |
| July 2008 | 23,354 | $236,074 | $324,550 | $475,000 |
| June 2008 | 22,657 | $239,150 | $324,920 | $479,459 |
| May 2008 | 21,505 | $239,900 | $325,000 | $480,947 |
| April 2008 | 20,669 | $239,900 | $324,937 | $479,912 |
| March 2008 | 19,381 | $241,300 | $324,860 | $485,960 |
| February 2008 | 18,409 | $240,485 | $324,925 | $479,912 |
| January 2008 | 17,659 | $243,500 | $324,962 | $481,765 |
| December 2007 | 18,584 | $245,120 | $327,975 | $489,355 |
| November 2007 | 19,926 | $248,665 | $330,475 | $486,425 |
| October 2007 | 20,762 | $249,950 | $337,260 | $493,980 |
| September 2007 | 20,656 | $253,425 | $339,900 | $497,749 |
| August 2007 | 19,837 | $257,712 | $342,975 | $499,124 |
| July 2007 | 18,710 | $261,120 | $349,120 | $499,930 |
| June 2007 | 17,670 | $264,282 | $349,950 | $507,949 |
| May 2007 | 16,386 | $264,900 | $350,975 | $512,662 |
| April 2007 | 15,059 | $264,900 | $354,740 | $517,740 |
| March 2007 | 13,897 | $264,450 | $353,850 | $523,425 |
| February 2007 | 13,814 | $258,517 | $349,800 | $516,750 |
| January 2007 | 13,726 | $255,810 | $349,637 | $507,441 |
| December 2006 | 14,746 | $257,149 | $348,246 | $499,949 |
| November 2006 | 15,671 | $258,837 | $348,750 | $499,900 |
| October 2006 | 16,027 | $259,640 | $348,834 | $499,900 |
| September 2006 | 15,239 | $261,098 | $349,675 | $499,937 |
| August 2006 | 14,029 | $264,925 | $350,737 | $518,587 |
| July 2006 | 12,864 | $264,920 | $350,470 | $525,980 |
| June 2006 | 11,261 | $264,925 | $349,975 | $530,937 |
| May 2006 | 9,804 | $262,340 | $350,940 | $532,360 |
| April 2006 | 8,701 | $256,433 | $346,433 | $526,224 |
The Department of Numbers contextualizes public data so that individuals can form independent opinions on everyday social and economic matters.

The Portland Historic Landmarks Commission voted to approve the landmark designation of Washington High School on January 14, 2013. This designation is the first step in Venerable’s ultimate goal of rehabilitating the 1923 brick building. Landmark designation brings with it local incentives for historic preservation, in addition to further regulation including historic design review and restrictions against demolition.
The designation document makes a strong case for Washington High School local significance, as the property helps tell the story of Portland’s changing education system during the first half of the 20th century. This period was marked by the need for expanded school facilities; growing concerns around health and safety, with a particular focus on fire prevention; and school designs that offered optimal learning environments as espoused by education experts at the time.
Below is an excerpt from the landmark nomination, explaining the building’s historical significance and the ways in which Washington High School’s design and construction embodies the priorities, values, and challenges of its time:
The construction of Washington High School began in 1923 after a fire destroyed much of the 1906 Washington High School in the year prior. The new building fully utilized “fireproof” construction techniques of the time. It is a significant example of a building constructed with a structural system entirely of concrete including slabs, columns, and beams. The exterior was faced with red brick and the walls were constructed of plaster-cement-finished clay masonry. There is very little wood in the building. Even the stairs and flooring are concrete.
The new Washington High School was constructed amidst an established campus of buildings that included the original Hawthorne School (1897-1900, demolished), Manual Training Building (1908, demolished), Gymnasium (1911, demolished) and a Boiler Building (1912, extant). Construction was completed and Washington High School opened its doors to students in 1924.
The Washington High School campus was and still is a prominent feature in the Buckman neighborhood. Buckman is a dense early-20th-Century streetcar suburb that grew significantly in response to the building of bridges over the Willamette River, the development of streetcar lines that connected to downtown Portland, and the population explosion that occurred as a result of the 1905 Lewis and Clark Centennial Exposition. Buckman was home to a rapidly growing middle class in Portland, which included families with school-age children.
The 1906 Washington High School was an immediate response to Buckman’s changing demographics. The 1924 Washington High School continued the tradition of a landmark building at the corner of SE Stark and Morrison after the former school burned, further expanding capacity while incorporating design principles idealized at the time. Namely, it was organized around a central auditorium and had many specialized spaces included a library, science labs, music room, and cafeteria. In addition, Washington High School also maintains one of the most substantial compositions of Classical Revival detailing on Portland’s eastside, as evidenced in the symmetry of windows and vertical elements, Classical details and reliefs in terra cotta, and a monumental entrance vestibule. It is interesting to note that the classical symmetry of the exterior maintains such primacy that stairwell landings occur in the middle of window openings. The inspirational quality of the Classical Revival design is further enhanced by six quotes featured on the building exterior in glazed terra cotta panels.
The building’s large twelve-over-one wood windows are not only a key feature of the architect’s Classical composition, but the windows are clustered in groups of three or four to optimize the amount of daylight that could enter each classroom space. “Breeze shields” are found in the classrooms, which could be placed in front of an open window, forcing the airflow in an upward direction rather than horizontally across a desk.
Washington High School’s significance as a Classical Revival high school is not only a reflection of the ideals of educational facility design during this period, but reflects the expertise of its architects Luther Lee Dougan and Chester A. Houghtaling. While the first Washington High School featured Romanesque design influences, Houghtaling & Dougan pursued the more monumental Classical Revival style for the building’s replacement—a style they had executed previously in Portland with much success.
Portland Public Schools hired Houghtaling & Dougan because they were without a district architect during the time period of 1920 to 1924. Floyd A. Naramore had recently resigned in 1919 to work as Seattle’s school architect. He was originally hired in 1912 when the District recognized the need for in-house expertise to deal with the design of fireproof masonry buildings. In the aftermath of Naramore’s departure, Portland Public Schools had to briefly rely on outside architects to design and manage much of the new construction, including Washington High School. The firm Houghtaling & Dougan was considered to be a versatile team and they designed many different types of buildings ranging from industrial warehouses to schools to major civic buildings such as the Elks Temple.
In 1978, Washington High School merged with Monroe High School—an all-girls polytechnic sister school to Benson Polytechnic High School—and the school then became known as Washington-Monroe High School. Not long after, the school experienced declining enrollment and closed its doors in 1981. Two years later the facility was reopened as the Children’s Service Center. This multipurpose facility served multiple tenants that included a day care center, a vocational program for Native American youth and the district’s continuing education center for at-risk pregnant girls. The Children’s Service Center closed in the 1990s and the building has been largely vacant since that time.
Notable alumni of Washington High School include Steven G. Bradbury, attorney, United State Department of Justice; Bill Naito, longtime Portland businessman and civic leader; and Linus Pauling, two-time Nobel Prize winner. Pauling was awarded his diploma in 1962, 45 years after leaving Washington High School prior to graduating in order to attend Oregon State University.
Contact Venerable: 503-224-2446
With inventories down and prices up, sellers are ending the costly incentives they have been forced to offer buyers during the six-year long buyers’ market. Concession-free transactions make deal-making simple on both sides of the table.
There’s no better gauge of the onset of a seller’s market than the demise of concessions that were considered essential to attract buyer interest just a few months ago. The National Association of REALTORS®’ December REALTOR® Confidence Outlook reported that the market has steadily moved towards a seller’s market with buyers more willing to bear closing costs, in some cases paying for half or more of the closing cost. Tight inventories of homes for sale are making markets increasingly competitive.
NAR reports that last year 60 percent of all sellers offered incentives to attract buyers. The most popular was a free home warranty policy, which costs about $500, offered by 22 percent of sellers, but 17 percent upped the ante by paying a portion of buyers’ closing costs and 7 percent contributed to remodeling or repairs.
Concessions linger where inventories are still adequate and sales slow, but in tight markets like Washington D.C., the times when buyers can expect concessions are already over.
“Buyers are discovering, to their dismay that homes they wanted to see or possibly buy have already been snatched up before they even get a chance to see or make an offer on the property. This area’s unprecedented low inventory levels are slowly driving up home prices and making sellers reluctant to cede little if any concessions to buyers. Realtors are warning (or should in some cases) buyers to be prepared to act that day if they are interested in a property,” reporters a local broker.
In Albuquerque, supply is dwindling and sales are moving to a more balanced market. “Buyers can expect sellers to offer less concessions and sales prices will be close to list price,” reports broker Archie Saiz.
In Seattle, not only are concessions a thing of the past, desperate buyers are even resorting to writing “love letters” to win over sellers in competitive situations. Lena Maul, a broker/owner in Lynnwood, reports a successful letter-writing effort last month by one of her office’s clients. Those buyers, who were using FHA financing, wrote a letter introducing themselves to the seller and explaining why they liked the home so much. After reviewing 13 offers, including one from an all-cash investor, the seller chose the letter-writer’s offer.
New regulations enacted last year by the Federal Housing Administration to limit its exposure to risk forced many sellers to cut back on the amount of assistance on buyers’ closing costs. Sellers are now limited to no more than six percent of the loan amount.
Underwriting standards on conventional mortgages also have the effect of limiting the amount sellers can contribute.
In recent years many lenders have disallowed seller paid closing costs on 100 percent financed home loans because of the high foreclosure rate.
However, seller paid closing costs are typically limited to 6 percent of the loan amount at 90 percent loan-to-value or lower, 3 percent between 90-95 percent, and then usually 3 percent for 100 percent loan-to-value.
Some sellers bump up the home sales price to pay for concessions. However the buyer will need to get the higher amount he will need to borrow covered by the appraisal and he will have to meet increased debt-to-income ratio in order to close his loan.
The demise of concessions will make buying and selling a little simpler and more rational. As one observed asked, “Why would anyone selling a home pay the home buyer to buy it?”
For more information, visit www.realestateeconomywatch.com
In the past few years, Americans have certainly learned a thing or two about how quickly disaster can strike.
And with each Hurricane Sandy, housing crisis, and stock market crash that rocks our world, we’re faced with the harsh realization that many of us simply aren’t prepared for the worst. A sobering new report by the Corporation for Enterprise Development shows nearly half of U.S. households (132.1 million people) don’t have enough savings to weather emergencies or finance long-term needs like college tuition, health care and housing.
According to the Assets & Opportunity Scorecard, these people wouldn’t last three months if their income was suddenly depleted. More than 30 percent don’t even have a savings account, and another 8 percent don’t bank at all.
We’re not just talking about people who living people the poverty line, either. Plenty of the middle class have joined the ranks of the “working poor,” struggling right alongside families scraping by on food stamps and other forms of public assistance.
More than one-quarter of households earning $55,465 to $90,000 annually have less than three months of savings. And another quarter of households are considered net worth asset poor, meaning “the few assets they have, such as a savings account or durable assets like a home, business or car, are overwhelmed by their debts,” the study says.
BASIC NECESSITIES
One of the prolonging reasons consumers have consistently struggled to make ends meet has more to do with larger economic issues than whether or not they can balance a checkbook. According to the report, household median net worth declined by over $27,000 from its peak in 2006 to $68,948 in 2010, and at the same time, the cost of basic necessities like housing, food, and education have soared.
It’s a dichotomy that is hammered home in a new book by finance expert Helaine Olen. In Pound Foolish: Exposing the Dark Side of the Personal Finance Industry, Olen knocks down much of the commonly-spread advice that is sold by the personal finance industry –– the idea that if you’re not making ends meet in America, you’re doing something wrong.
“The problem was fixed cost, the things that are difficult to ‘cut back’ on. Housing, health care, and education cost the average family 75 percent of their discretionary income in the 2000s. The comparable figure in 1973: 50 percent,” Olen writes.
“And even as the cost of buying a house plunged in many areas of the country in the latter half of the 2000s (causing, needless to say, its own set of problems) the price of other necessary expenditures kept rising.”
And wherever consumers can’t cope with costs, they continue to rely on plastic. The average borrower carries more than $10,700 in credit card debt, one in five households still rely on high-risk financial services that target low-income and under-banked consumers.
Read more at http://www.thefiscaltimes.com/Articles/2013/02/04/Nearly-Half-of-US-Families-Teetering-on-Edge-of-Ruin.aspx#DVKZCYevJIMwCEyw.99
This past week, several reports were released, all of which showed that declining home inventory is affecting sales. This decline is creating a seller’s market in which multiple bids are being made to purchase homes. According to the National Association of Realtors, existing home sales fell 1% in December, but were still at the second highest level since November, 2009. Inventory of homes for sale fell 8.5 from November, the lowest level since January of 2001, and are down 21.6% from December of 2011.
Following that lead, pending home sales dropped 4.34% in December to 101.7 from 106.3 in November, yet was 6.9% higher than December, 2011, according to the National Association of Realtors. The Chief Economist at NAR stated that “supplies of homes costing less than $100,000 are tight in much of the country, especially in the West, so first time buyers have fewer options”. Mortgage ratesare still low, affordability is still there, but the available homes are dwindling. In the meantime, home prices are increasing at a faster pace. According to the latest S&P/Case-Shiller index for November, property values rose 5.5% from November of 2011 which was the highest year over year increase since August of 2006.
The cause of the low inventory can be attributed to several factors. For the week ending January 18th, loan applications increased 7.0% on a seasonally adjusted basis, according to the Mortgage Banker’s Association. The Refinance Index rose 8% with refinances representing 82% of all applications. The seasonally adjusted Purchase Index rose 3%, the highest level since May, 2010. Many homeowners have chosen a mortgage refinance instead of moving to another home which is one reason that inventory is down. In addition, many underwater homeowners have refinanced through the HARP program which is available for loans that were sold to Fannie Mae or Freddie Mac prior to June 1, 2009. These homeowners may not yet be in a position to sell their homes until they have gained back enough equity. As home prices increase, this will eventually happen. The same can be said for those who refinanced through the FHA streamline program which is offering reduced fees for loans that were endorsed prior to June 1, 2009. Refinancing through these two government programs, both available until the end of 2013, hit all time highs in 2012.
Home builders are busy, but not currently building new homes at the rate that was seen during the housing boom. According to the Census Bureau and the Department of Housing and Urban Development, total new homes sales in 2012 hit the highest level seen since 2009 and were up 19.9% from 2011. There was much progress made in 2012, but sales for new homes fell 7.3% in December.
On the down side, the Census Bureau reported that homeownership fell 0.6% to 65.4% during December, down from 65.5% at the end of October and 66% at the end of 2011. Homeownership reached a peak of 69.2% in 2004 and has been falling since that time. The latest Consumer Confidence index dropped to 58.6 which is the weakest since November of 2011. It was previously at a revised 66.7 in December. This fell more than expected and is due to the higher payroll tax that is taking more out of the pockets of consumers.
The housing market, which is still in recovery, remains fragile. The lack of inventory and the rise of home prices may affect its progress this year. As home prices increase, fewer consumers will be able to qualify for a home loan. Existing homeowners may choose to refinance remain where they are instead of purchasing another home. While jobless claims have fallen, there are still many consumers who are out of work or are working lower paid jobs. The housing market is dependent on jobs, not just for salaries, but for consumer movement from one area to another.
FreeRateUpdate.com surveys more than two dozen wholesale and direct lenders’ rate sheets to determine the most accurate mortgage rates available to well qualified consumers at about a 1 point origination fee.
http://ml-implode.com/viewnews/2013-01-30_DecliningHomeInventoryAffectingSales.html
![]()
Visit MultnomahForeclosures.com for the notice of default lists (Homes in Foreclosure) for Multnomah County and other Oregon counties.
Multnomah Country Foreclosures
http://multnomahforeclosures.com
Fred Stewart
Stewart Group Realty Inc.
info@sgrealtyinc.com
http://www.sgrealty.net
In a ruling the Oregon Supreme Court will soon review, the Oregon Court of Appeals on July 18 issued a major decision.The case, Niday v. Mortgage Electronic Registration Systems Inc., et al, held that MERS, when acting as a nominee for a named lender, is not a beneficiary under Oregon law. The practical effect of the holding is that any trust deed naming MERS the beneficiary may not be foreclosed in the name of MERS by the more expedient nonjudicial method.
A little context is in order.
In 1959, to remain competitive for loan dollars, Oregon adopted the Oregon Trust Deed Act to establish trust deeds as a real estate security instrument. For lenders needing to foreclose, the act created a summary, nonjudicial procedure that bypassed the courts and allowed no redemption rights for borrowers. Foreclosure previously was a judicial process taking two years or more to complete; now it could be done in six months with the summary procedure.
Lenders were happy because the time to liquidate a non-performing loan was substantially reduced. Borrowers benefited because there was no right to a deficiency if the debt exceeded the value of the property and borrowers could cure defaults during the foreclosure process by paying only the amount in arrears rather than the full loan balance.
Trust deeds quickly became the favored real estate security instrument.
In 1993, in part to respond to a growing practice wherein lenders were bundling loans secured by trust deeds and selling them in secondary markets, a group of mortgage industry participants formed MERS and the MERS system.
Anytime a loan is sold from one member of the MERS system to another, the sale is tracked using the MERS system. MERS, the named beneficiary as nominee for the original lender and its assigns, remains the beneficiary as the loan is sold and becomes an agent of the new note owner. With no change to the named beneficiary, there is nothing to publicly record, an administrative convenience accomplishing a central purpose of MERS.
As MERS grew in acceptance, so did its popularity. Nationwide, there are more than 3,000 lender members of MERS that account for approximately 60 percent of all real estate secured loans nationwide.
The onslaught of the Great Recession resulted in a tremendous spike in foreclosure activity. To defend foreclosure proceedings, borrowers challenged the authority of MERS, in its own name, to foreclose non-judicially.
Because the trust deed is a creature of statute, the statutory elements allowing a nonjudicial foreclosure must be followed strictly. One such element is the requirement that the name of the beneficiary and any assignee be in the public record. Niday argued that the lender, not MERS, was the beneficiary. MERS countered that it was the named beneficiary in the trust deed and had the contractual right to foreclose as nominee of the lender and its assigns.
The court sided with Niday, holding that MERS is not a “beneficiary” as defined by the act. The court wrote that the beneficiary is “the person to whom the underlying, secured obligation is owed.” It reasoned that because the lender is owed the money, that party is the beneficiary. Only the person to whom the obligation is owed and whose interest is of record may legally prosecute a nonjudicial foreclosure.
What does all of this mean? Maybe nothing if the Supreme Court finds that the Court of Appeals defined “beneficiary” too narrowly.
Short of that, many issues arise. What is the effect on completed nonjudicial foreclosures of MERS trust deeds? Such sales may be void, in which case the ownership and right to possession of thousands of foreclosed properties fall into legal limbo. Perhaps the sales are only voidable, requiring a lawsuit by the borrower within a limited time to challenge the foreclosure sale.
Titles may now be in doubt for people who bought properties either at a foreclosure sale or further along the line. Also, no market may exist for these properties if title insurers choose not to insure titles until there is some clarity.
Going forward, will MERS lenders do business in Oregon? And if so, at what cost? Loans may be more expensive to administer because they either require that all assignments be documented and recorded or foreclosure via the more expensive judicial method. As such, loans in Oregon could demand higher interest rates.
Courts will see a sharp increase in the number of judicial foreclosure filings; it’s happening in Multnomah County already. An already overcrowded judicial system will gain additional burdens.
The Legislature could step in to fix the issue by clarifying the definition of “beneficiary” to include a nominee of the lender, such as MERS. But is there political will to legislate a solution that, on the surface, seems to benefit lenders?
A practice that for many years roamed freely under the radar has suddenly exploded to the surface, leaving the mortgage industry in limbo. Quick answers to the numerous issues now pending are imperative to restore certainty to real estate markets.
Fannie Mae reported that the Single-Family Serious Delinquency rate declined in May to 3.57% from 3.63% April. The serious delinquency rate is down from 4.14% in May last year, and this is the lowest level since April 2009.
The Fannie Mae serious delinquency rate peaked in February 2010 at 5.59%.
Freddie Mac reported that the Single-Family serious delinquency rate declined slightly in May to 3.50%, from 3.51% in April. Freddie’s rate is only down from 3.53% in May 2011. Freddie’s serious delinquency rate peaked in February 2010 at 4.20%.
To Read the rest of this article go to calculatedriskblog.com
CoreLogic released the Q4 2011 negative equity report today.
CoreLogic … today released negative equity data showing that 11.1 million, or 22.8 percent, of all residential properties with a mortgage were in negative equity at the end of the fourth quarter of 2011. This is up from 10.7 million properties, 22.1 percent, in the third quarter of 2011. An additional 2.5 million borrowers had less than five percent equity, referred to as near-negative equity, in the fourth quarter. Together, negative equity and near-negative equity mortgages accounted for 27.8 percent of all residential properties with a mortgage nationwide in the fourth quarter, up from 27.1 in the previous quarter. Nationally, the total mortgage debt outstanding on properties in negative equity increased from $2.7 trillion in the third quarter to $2.8 trillion in the fourth quarter.
“Due to the seasonal declines in home prices and slowing foreclosure pipeline which is depressing home prices, the negative equity share rose in late 2011. The negative equity share is back to the same level as Q3 2009, which is when we began reporting negative equity using this methodology. The high level of negative equity and the inability to pay is the ‘double trigger’ of default, and the reason we have such a significant foreclosure pipeline. While the economic recovery will reduce the propensity of the inability to pay trigger, negative equity will take an extended period of time to improve, and if there is a hiccup in the economic recovery, it could mean a rise in foreclosures.” said Mark Fleming, chief economist with CoreLogic.
Here are a couple of graphs from the report:
 Click on graph for larger image.
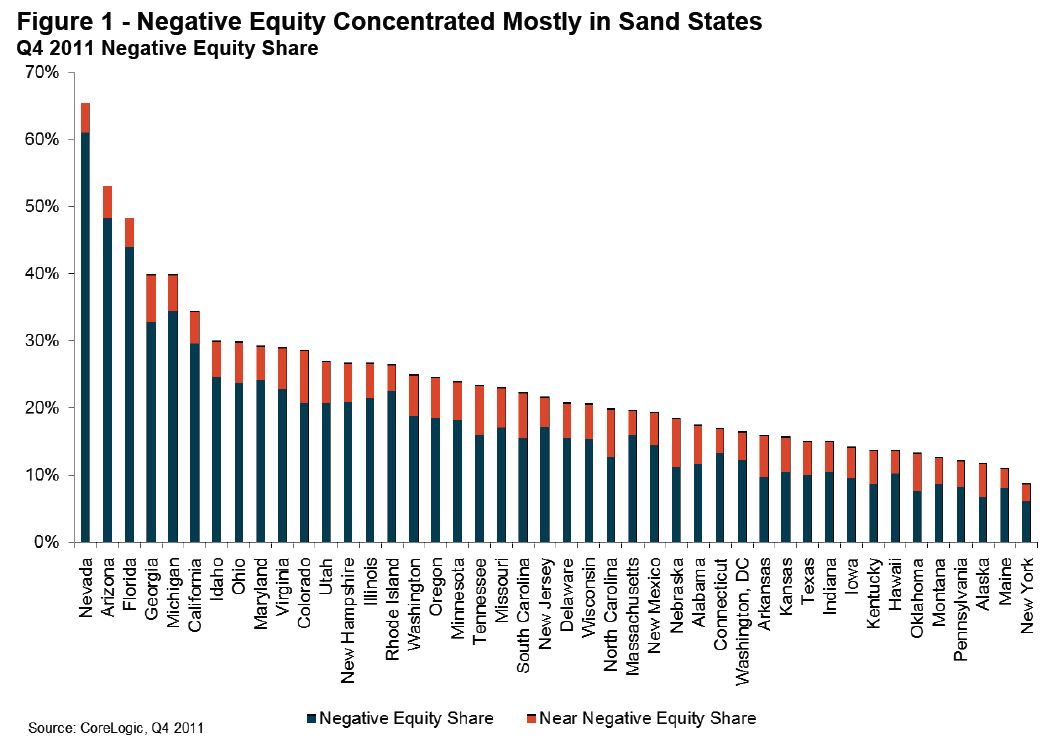
This graph shows the break down of negative equity by state. Note: Data not available for some states. From CoreLogic:
“Nevada had the highest negative equity percentage with 61 percent of all of its mortgaged properties underwater, followed by Arizona (48 percent), Florida (44 percent), Michigan (35 percent) and Georgia (33 percent). This is the second consecutive quarter that Georgia was in the top five, surpassing California (29 percent) which previously had been in the top five since tracking began in 2009. The top five states combined have an average negative equity share of 44.3 percent, while the remaining states have a combined average negative equity share of 15.3 percent.”
 The second graph shows the distribution of equity by state- black is Loan-to-value (LTV) of less than 80%, blue is 80% to 100%, red is a LTV of greater than 100% (or negative equity). Note: This only includes homeowners with a mortgage – about 31% of homeowners nationwide do not have a mortgage.
Some states – like New York – have a large percentage of borrowers with more than 20% equity, and Nevada, Arizona and Florida have the fewest borrowers with more than 20% equity.
Some interesting data on borrowers with and without home equity loans from CoreLogic: “Of the 11.1 million upside-down borrowers, there are 6.7 million first liens without home equity loans. This group of borrowers has an average mortgage balance of $219,000 and is underwater by an average of $51,000 or an LTV ratio of 130 percent.
The remaining 4.4 million upside-down borrowers had both first and second liens. Their average mortgage balance was $306,000 and they were upside down by an average of $84,000 or a combined LTV of 138 percent.”
Seventeen states have now introduced bills for state-owned banks, and others are in the works. Hawaii’s innovative state bank bill addresses the foreclosure mess. County-owned banks are being proposed that would tackle the housing crisis by exercising the right of eminent domain on abandoned and foreclosed properties. Arizona has a bill that would do this for homeowners who are current in their payments but underwater, allowing them to refinance at fair market value.
The long-awaited settlement between 49 state Attorneys General and the big five robo-signing banks is proving to be a majordisappointment before it has even been signed, sealed and court approved. Critics maintain that the bankers responsible for the housing crisis and the jobs crisis will again be buying their way out of jail, and the curtain will again drop on the scene of the crime.
We may not be able to beat the banks, but we don’t have to play their game. We can take our marbles and go home. The Move Your Money campaign has already prompted more than 600,000 consumers to move their funds out of Wall Street banks into local banks, and there are much larger pools that could be pulled out in the form of state revenues. States generally deposit their revenues and invest their capital with large Wall Street banks, which use those hefty sums to speculate, invest abroad, and buy up the local banks that service our communities and local economies. The states receive a modest interest, and Wall Street lends the money back at much higher interest.
Rhode Island is a case in point. In an article titled “Where Are R.I. Revenues Being Invested? Not Locally,” Kyle Hence wrote in ecoRI Newson January 26th:
According to a December Treasury report, only 10 percent of Rhode Island’s short-term investments reside in truly local in-state banks, namely Washington Trust and BankRI. Meanwhile, 40 percent of these investments were placed with foreign-owned banks, including a British-government owned bank under investigation by the European Union.
Further, millions have been invested by Rhode Island in a fund created by a global buyout firm . . . . From 2008 to mid-2010, the fund lost 10 percent of its value — more than $2 million. . . . Three of four of Rhode Island’s representatives in Washington, D.C., count [this fund] amongst their top 25 political campaign donors . . . .
Hence asks:
Are Rhode Islanders and the state economy being served well here? Is it not time for the state to more fully invest directly in Rhode Island, either through local banks more deeply rooted in the community or through the creation of a new state-owned bank?
Hence observes that state-owned banks are “[o]ne emerging solution being widely considered nationwide . . . . Since the onset of the economic collapse about five years ago, 16 states have studied or explored creating state-owned banks, according to a recent Associated Press report.”
2012 Additions to the Public Bank Movement
Make that 17 states, including three joining the list of states introducing state bank bills in 2012: Idaho (a bill for a feasibility study), New Hampshire (a bill for a bank), and Vermont (introducing THREE bills—one for a state bank study, one for a state currency, and one for a state voucher/warrant system). With North Dakota, which has had its own bank for nearly a century, that makes 18 states that have introduced bills in one form or another—36% of U.S. states. For states and text of bills, see here.
Other recent state bank developments were in Virginia, Hawaii, Washington State, and California, all of which have upgraded from bills to study the feasibility of a state-owned bank to bills to actually establish a bank. The most recent, California’s new bill, was introduced on Friday, February 24th.
All of these bills point to the Bank of North Dakota as their model. Kyle Hence notes that North Dakota has maintained a thriving economy throughout the current recession:
One of the reasons, some say, is the Bank of North Dakota, which was formed in 1919 and is the only state-owned or public bank in the United States. All state revenues flow into the Bank of North Dakota and back out into the state in the form of loans.
Since 2008, while servicing student, agricultural and energy— including wind — sector loans within North Dakota, every dollar of profit by the bank, which has added up to tens of millions, flows back into state coffers and directly supports the needs of the state in ways private banks do not.
Publicly-owned Banks and the Housing Crisis
A novel approach is taken in the new Hawaii bill: it proposes a program to deal with the housing crisis and the widespread problem of breaks in the chain of title due to robo-signing, faulty assignments, and MERS. (For more on this problem, see here.) According to a February 10th report on the bill from the Hawaii House Committees on Economic Revitalization and Business & Housing:
The purpose of this measure is to establish the bank of the State of Hawaii in order to develop a program to acquire residential property in situations where the mortgagor is an owner-occupant who has defaulted on a mortgage or been denied a mortgage loan modification and the mortgagee is a securitized trust that cannot adequately demonstrate that it is a holder in due course.
The bill provides that in cases of foreclosure in which the mortgagee cannot prove its right to foreclose or to collect on the mortgage, foreclosure shall be stayed and the bank of the State of Hawaii may offer to buy the property from the owner-occupant for a sum not exceeding 75% of the principal balance due on the mortgage loan. The bank of the State of Hawaii can then rent or sell the property back to the owner-occupant at a fair price on reasonable terms.
Arizona Senate Bill 1451, which just passed the Senate Banking Committee 6 to 0, would do something similar for homeowners who are current on their payments but whose mortgages are underwater (exceeding the property’s current fair market value). Martin Andelman callsthe bill a “revolutionary approach to revitalizing the state’s increasingly water-logged housing market, which has left over 500,000 ofArizona’s homeowners in a hopelessly immobile state.”
The bill would establish an Arizona Housing Finance Reform Authority to refinance the mortgages of Arizona homeowners who owe more than their homes are currently worth. The existing mortgage would be replaced with a new mortgage from AHFRA in an amount up to 125% of the home’s current fair market value. The existing lender would get paid 101% of the home’s fair market value, and would get a non-interest-bearing note called a “loss recapture certificate” covering a portion of any underwater amounts, to be paid over time. The capital to refinance the mortgages would come from floating revenue bonds, and payment on the bonds would come solely from monies paid by the homeowner-borrowers. An Arizona Home Insurance Fund would create a cash reserve of up to 20 percent of the bond and would be used to insure against losses. The bill would thus cost the state nothing.
Critics of the Arizona bill maintain that it shifts losses from collapsed property values onto banks and investors, violating the law of contracts; and critics of the Hawaii bill maintain that the state bank could wind up having paid more than market value for a slew of underwater homes. An option that would avoid both of these objections is one suggested by Michael Sauvante of the Commonwealth Group, discussed earlierhere: the state or county could exercise its right of eminent domain on blighted, foreclosed and abandoned properties. It could offer to pay fair market value to anyone who could prove title (something that with today’s defective title records normally can’t be done), then dispose of the property through a publicly-owned land bank as equity and fairness dictates. If a bank or trust could prove title, the claimant would get fair market value, which would be no less than it would have gotten at an auction; and if it could not prove title, it legally would have no claim to the property. Investors who could prove actual monetary damages would still have an unsecured claim in equity against the mortgagors for any sums owed.
Rhode Island Next?
As the housing crisis lingers on with little sign of relief from the Feds, innovative state and local solutions like these are gaining adherents in other states; and one of them is Rhode Island, which is in serious need of relief. According to The Pew Center on the States, “The country’s smallest state . . . was one of the first states to fall into the recession because of the housing crisis and may be one of the last to emerge.”
Rhode Islanders are proud of having been first in a number of more positive achievements, including being the first of the 13 original colonies to declare independence from British rule. A state bank presentation was made to the president of the Rhode Island Senate and other key leaders earlier this month that was reportedly well received. Proponents have ambitions of making Rhode Island the first state in this century to move its money out of Wall Street into its own state bank, one owned and operated by the people for the people.
Ellen Brown is an attorney and president of the Public Banking Institute, http://PublicBankingInstitute.org. In Web of Debt, her latest of eleven books, she shows how a private cartel has usurped the power to create money from the people themselves, and how we the people can get it back. Her websites are http://WebofDebt.com and http://EllenBrown.com.
Ellen Brown is a frequent contributor to Global Research. Global Research Articles by Ellen Brown
© Copyright Ellen Brown 2012
Disclaimer: The views expressed in this article are the sole responsibility of the author and do not necessarily reflect those of the Centre for Research on Globalization. The contents of this article are of sole responsibility of the author(s). The Centre for Research on Globalization will not be responsible or liable for any inaccurate or incorrect statements contained in this article.
http://www.marketoracle.co.uk/Article33365.html
Financial Force Majeure: The Virtual World Taylored to Our Real World
If any of you have ever played the virtual reality game, Sim City or any similar, you will probably appreciate the point to be made more immediately than those unfamiliar. For the unfamiliar, this is a game in which you are the master of the land, tasked with taking what amounts to any empty field and building, expanding, and developing yourself a thriving metropolis.
This entails tapping into the natural resources that are available within your splotch of land, thereby harnessing those resources to grow your community. As master of your domain, you have to the politician, the banker, the shopkeeper too, making wise decisions with your electronic currency inasmuch as budgeting and investment are concerned. You have to provide the infrastructure, exploiting what resources you have to attract more Sims (the inhabitants of your city) to further grow your town.
You zone the land for residential, commercial, and industrial zones and providing for greenbelt, park, and recreational zones. You build schools, banks, retail and shopping centers, single-family and multi-family residential, industrial, and hospitals. As in the real world, this is done through various types of investment deals in the both the private and public sectors, involving commercial and investment banks, private investors and businesses. Your metropolis’ success depends on good investment strategies.
Mother Nature is an ever present threat, just as in the real world, throwing a natural disaster your way now and again. Of course, disaster strikes when least expected, testing the validity of your decisions, most of all your infrastructure. It is than you discover if value engineering the levy walls was such a good idea. Should news of cutting corners for costs leaks out, it costs your city, as restitution to flood victims is yours to bear.
Of course, the entirety is based on a designed program consisting of a language, codes, and locks. As with any program there savvy programmers, some might say hackers, having the learned knowledge to manipulate codes, language, and changing locks or even to remove locks. Purposes in hacking games might be to expand the games capabilities or to be able to be able to skip ahead to more advanced levels without having to play through the levels not desired.
Virtual reality games are rooted in fantasy, even if based on real situations, there is no tangible result. Emotional personal satisfaction or perhaps of monetary award if in some sort of competition is the best reward one can hope for. You can’t physically walk the streets of your city, go to one of its schools, or benefit from the investment dividends in terms of attaining real dollars.
For the developers, the tangible aspects are realized by sales which return in real dollars to the owners of the rights to the game. The developers might not necessarily be the owners either, depending on whether the developers retain rights or assigned them away to another.
The point to take away from this little piece is more of a question. What if, with highly sophisticated programming, it was possible to design investment strategies, for instance and than somehow apply them to the real world? What if it has already been done…..What if our whole entire economy has been modeled in the virtual world, brought forth into the real world?
Sound ridiculous? ………think again…….
INFORMATION PROCESSING SYSTEM FOR SEAMLESS VIRTUAL TO REAL WORLD OPERATIONS
US Patent Pub. No.: US 2002/0188760 Al
SECURING CONTRACTS IN A VIRTUAL WORLD
US Patent Pub. No.: US 2007/0117615
WEB DEPENDENT CONSUMER FINANCING AND VIRTUAL RESELLING METHOD
US Patent Pub. No.: US 2001/0056399 A1
TRANSACTIONS IN VIRTUAL PROPERTY
US Patent Pub. No.: US 2005/0021472 Al
VIRTUAL FINANCE/INSURANCE COMPANY
US Patent Pub. No.: US 2003/0187768 A1
What we need to do is take a survey, the population being made up of mortgage borrowers between the years 2002-2008. Why these years would become apparent with the results, which can be predicted before ever tallying the results. It would be a one question survey:
“Upon loan origination, was it required, in addition to completing a loan 1003 loan application, that you also provide specific documents for verification and loan qualification purposes, or did you simply have to complete a loan 1003 loan application?”
My bet would be that most everyone who was in receipt of a loan prior to September 2005 was required to submit documents to a human person which were used to verify loan qualification. Most nearly everyone subsequent that date was not required to submit anything by way of supporting documents.
This gives us two separately defined groups:
GROUP A: borrowers whose loans were humanly underwritten and verified
GROUP B: borrowers whose loans were underwritten entirely by automation
We can argue about the underlying reasons for economic collapse all day long, as there are certainly many, but one fact remains as being integral. This is acknowledging that there were borrowers that never, ever should have been approved for a loan, yet were. It was this very small subset of borrowers in Group B however, those that defaulted nearly immediately, that is within the first through third months out of the gate. It was these ‘early payment defaults (EPD’s ) that spread throughout the investment community causing fear, bringing into question the quality of all loan originations, thereby freezing the credit markets in August 2007, a year later the entire economy collapsed.
Of course, it is much more complex than that, but the crucial piece that provided the catalyst was these EPD’s. It was the quality of the borrowers from these EPD’s that became the model by which was used to stigmatize all borrowers. What was needed was a fall guy, to first lessen the anger towards the bailouts in providing a scapegoat, and second to divert attention away from the facts underlying the lending standards the failed and/or intentionally purposeful failure of the automation. From my research, it was with purposeful intent come hell or high water is my mission in life to bring forth into the public light.
Putting intent aside for the moment and just focusing on the EPD’s and the domino effect they caused which resulted in millions of borrowers, from both Groups A and B, to lose their homes or struggling to hold on. How could one small group of failed borrowers affect millions of other borrowers, especially those who were qualified through the traditional methods of underwriting?
The answer is an obvious one, coming down to the one common element that is the structuring of the loan products, that as it relates to the reset. Anyone whose reset occurred just prior and certainly after the economic collapse was as the saying goes…..Screwed. It is within is this, that the Grand Illusion lay intentionally concealed and hidden. It is within the automation wherein all the evidence clearly points to the fact that a mortgage is not a mortgage but rather a basket of securities….Not just any securities, but debt defaultable securities. In other words, it was largely planned to intentionally give loans to those whom were known to result in default.
But, even without understanding any of the issues as to the ‘basket of securities” there is one obvious point that looms, hiding in plain sight, which I believe should be completely exploited. This as it directly relates to our mortal enemy, that which takes the name of MERS. I know there are those that disseminate the structure of Mortgage Electronic Registration Systems, Inc and Merscorp as it relates to the MIN number and want to pick it apart, and all this is well and good. However, they miss the larger and more obvious point that clearly gives some definition.
There is one particular that every one of those millions upon millions of borrowers, those in both Group A and Group B along with the small subset of Group B, all have in common. ……MERS. MERS was integrated into every set of loan documents, slide past the borrowers without explanation without proper representation in concealing the implied contracts behind the trade and service mark of MERS.
MERS does not discriminate between a good or a bad loan, a loan is a loan as far it is concerned, whether it was fraudulently underwritten or perfectly underwritten. If it is registered with MERS the good, the bad, the ugly all go down, and therein lays an issue that is pertinent to discussion.
MERS was written into all Fannie and Freddie Uniform Security Instrument, not by happenstance, rather mandated by Fannie and Freddie. It was they who crafted verbiage and placement within the document. Fannie and Freddie are of course agency loans, however nearly 100% of non-agency lenders utilized the same Fannie and Freddie forms. Put into context, MERS covers both agency and non-agency, and not surprisingly members of MERS as well. Talk about fixing the game!!
It would seem logical, considering we, the American Taxpayer own Fannie Mae, that we should be entitled some answers to some very basic questions……The primary question: If Fannie Mae and Freddie Mac mandated that MERS play the role that it does, why than were there no quality control measures in place, and should they not have been responsible for putting in some safety measures in place?
The question is a logical one; any other business would have buried in litigation had a product it sponsored or mandated, as the case may be here, resulted in complete failure. From the standpoint of public policy, MERS was a tremendous failure. Why? The answer derives itself from the facts as laid out above regarding the underwriting processes and the division of borrowers: Group A and B.
This becomes a pertinent taking into account Fannie Mae on record in its recorded patents.
US PATENT #7,881,994 B1– Filed April 1, 2004, Assignee: Fannie Mae
‘It is well known that low doc loans bear additional risk. It is also true that these loans are
charged higher rates in order to compensate for the increased risk.’
US PATENT # 7,653,592– Filed December 30, 2005, Assignee: Fannie Mae
The following from the Summary section states:
‘An exemplary embodiment relates to a computer-implemented mortgage loan application data processing system comprising user interface logic and a workflow engine. The user interface logic is accessible by a borrower and is configured to receive mortgage loan application data for a mortgage loan application from the borrower. The workflow engine has stored therein a list representing tasks that need to be performed in connection with a mortgage loan application for a mortgage loan for the borrower. The tasks include tasks for fulfillment of underwriting conditions generated by an automated underwriting engine. The workflow engine is configured to cooperate with the user interface logic to prompt the borrower to perform the tasks represented in the list including the tasks for the fulfillment of the underwriting conditions. The system is configured to provide the borrower with a fully-verified approval for the mortgage loan application. The fully-verified approval indicates that the mortgage loan application data received from the borrower has already been verified as accurate using information from trusted sources. The fully-verified approval is provided in a form that allows the mortgage loan application to be provided to different lenders with the different lenders being able to authenticate the fully-verified approval status of the mortgage loan application’
Computerized systems and methods for facilitating the flow of capital
through the housing finance industry
US PATENT # 7,765,151– Filed July 21, 2006, Assignee: Fannie Mae
The following passages taken from patent documents reads:
‘The prospect or other loan originator preferably displays generic interest rates (together with an assumptive rate sheet, i.e., current mortgage rates) on its Internet web site or the like to entice online mortgage shoppers to access the web site (step 50). The generic interest rates (“enticement rates”) displayed are not intended to be borrower specific, but are calculated by pricing engine 22 and provided to the loan originator as representative, for example, of interest rates that a “typical” borrower may expect to receive, or rates that a fictitious highly qualified borrower may expect to receive, as described in greater detail hereinafter. FIG. 2b depicts an example of a computer Internet interface screen displaying enticement rates.’
’If the potential borrower enters a combination of factors that is ineligible, the borrower is notified immediately of the ineligibility and is prompted to either change the selection or call a help center for assistance (action 116). It should be understood that this allows the potential borrower to change the response to a previous question and then continue on with the probable qualification process. If the potential borrower passes the eligibility screening, the borrower then is permitted to continue on with the probable qualification assessment.’
‘Underwriting engine 24 also determines, for each approved product, the minimum amount of verification documentation (e.g., minimum assets to verify, minimum income to verify), selected loan underwriting parameters, assuming no other data changes, (e.g., maximum loan amount for approval, maximum loan amount for aggregating closing costs with the loan principal, and minimum refinance amount), as well as the maximums and minimums used to tailor the interest rate quote (maximum schedule interest rate and maximum number of points) and maximum interest rate approved for float up to a preselected increase over a current approved rate. It should be appreciated that this allows the potential borrower to provide only that information that is necessary for an approval decision, rather than all potentially relevant financial and other borrower information. This also reduces the processing burden on system.’
The two patents above was Fannie Mae’s means of responding to its competition, that being the non-agency who had surpassed the agencies in sales volume (those stats I will have to dig up and repost as they are not handy at the moment), as the non-agencies had dropped all standards back in and around September 2005.
The point being though, Fannie Mae and Freddie Mad were the caretakers of MERS, so to speak, inasmuch as mandating MERS upon the borrowers. Had there been safety measures in place that caught the fact that the loans that were dumping out quickly, that is the EPD’s, there might have been a stoppage in place, thereby preventing MERS from executing foreclosures upon every successive mortgage.
I know that this is all BS though, because it is a cover up, a massive one that cuts into the heart of the United States government. This is perhaps one avenue by which to get there, as the questions asked are easily understood, as opposed to digging into the automation processes which people apparently are not ready to accept as of yet.
Massive intervention by Federal agencies and the Federal Reserve have kept the market from discovering price and the risk premium in real estate. That sets up a “catch the falling knife” possibility for impatient real estate investors.
A substantial percentage of many households’ net worth is comprised of the equity in their home. With the beating home prices have taken since 2007, existing and soon-to-be homeowners are keen to know: Are prices stabilizing? Will they begin to recover from here? Or is the “knife” still falling?
To understand where housing prices are headed, we need to understand what drives them in the first place: policy, perception, and price discovery.
In my December 2011 look at housing, I examined systemic factors such as employment and demographics that represent ongoing structural impediments to the much-awaited recovery in housing valuations and sales. This time around, we’re going to consider policy factors that influence the housing market.
Yesterday while standing in line at our credit union I overheard another customer at a teller’s window request that her $100,000 Certificate of Deposit (CD) be withdrawn and placed in her checking account because, she said, “I’m not earning anything.” The woman was middle-aged and dressed for work in a professional white- collar environment — a typical member, perhaps, of the vanishing middle class.
Sadly, she is doing exactly what Ben Bernanke’s Federal Reserve policies are intended to push people into doing: abandoning capital accumulation (savings) in favor of consumption or trying for a higher yield in risk assets such as stocks and real estate.
It may strike younger readers as unbelievable that a few decades ago, in the low-inflation 1960s, savings accounts earned a government-stipulated minimum yield of 5.25%, regardless of where the Fed Funds Rate might be. Capital accumulation was widely understood to be the bedrock of household financial security and the source of productive lending, whether for 30-year home mortgages or loans taken on to expand an enterprise.
How times — and the US economy — have changed.
Now the explicit policy of the nation’s private central bank (the Federal Reserve) and the federal government’s myriad housing and mortgage agencies is to punish saving with essentially negative returns in favor of blatant speculation with borrowed money. Official inflation is around 3% and savings accounts earn less than 0.1%, leaving savers with a net loss of about 3% every year. Even worse — if that is possible — these same agencies have extended housing lenders trillions of dollars in bailouts, backstops and guarantees, creating institutionalized moral hazard on an unprecedented scale.
Recall that moral hazard simply means that the relationship between risk and return and has been severed, so risk can be taken in near-infinite amounts with the assurance that if that risk blows up, the gains remain in the hands of the speculator. Another way of describing this policy of government bailouts is “profits are private but losses are socialized.” That is, any profits earned from risky speculation are the speculator’s to keep, while all the losses are transferred to the public.
While the housing bubble was most certainly based on a credit bubble enabled by lax oversight and fraudulent practices, the aftermath can be fairly summarized as institutionalizing moral hazard.
Quasi-official pronouncements by Fed Board members suggest that the Fed’s stated policy of punishing savers with a zero-interest rate policy (ZIRP) is outwardly designed to lower the cost of refinancing mortgages and buying a house. The first is supposed to free up cash that households can then spend on consumption, thereby boosting the economy. With savings earning a negative yield, consuming more becomes a tangibly attractive alternative. (How keeping the factories in Asia humming will boost the American economy is left unstated.)
This near-complete destruction of investment income from household savings yields a rather poor return. Plausible estimates of the total gain that could be reaped by widespread refinancing hover around $40 billion a year, which is not much in a $15 trillion economy.
There are real-world limits on this policy as well. Since the Fed can’t actually force lenders to refinance underwater mortgages, millions of homeowners are unable to take advantage of lower rates. From the point of view of lenders, declining household incomes and mortgages that exceed the home value (so-called negative equity) have lowered the creditworthiness of many homeowners.
As a result, the stated Fed policy goal of lowering mortgage payments to boost consumer spending has met with limited success. Somewhat ironically, the mortgage industry’s well-known woes — extended time-frames for involuntary foreclosure, lenders’ hesitancy to concede to short sales (where the house is sold for less than the mortgage and the lender absorbs a loss), and strategic/voluntary defaults — may be putting an estimated $80 billion in “free cash” that once went to mortgages into defaulting consumer’s hands.
The failure of the Fed’s policies to increase household’s surplus income via ZIRP leads us to the second implicit goal, lowering the cost of home ownership via super-low mortgage rates, which serves both as behavior modification and perception management. If low-interest rate mortgages and subsidized Federal programs that offer low down payments drop the price of home ownership below that of renting an equivalent house, then there is a substantial financial incentive to buy rather than rent.
The implicit goal is to shape a general perception that the bottom is in, and it’s now safe to buy housing.
First-time home buying programs and FHA (Federal Housing Authority) and VA (Veterans Administration) loans all offer very low down-payment options to qualified buyers. This extends a form of moral hazard to buyers as well as lenders: If a buyer need only scrape up $2,000 to buy a house, their losses are limited should they default to this same modest sum. Meanwhile, lenders working under the guarantee of FHA- and VA-backed loans are also insured against losses.
The Fed’s desire to boost home sales by any means available is transparent. By boosting home sales, it hopes to stem the decline of house valuations and thus stop the hemorrhaging of bank losses from writing down impaired loan portfolios, and also stabilize remaining home equity for households, which has shrunk to a meager 38% of housing value.
As many have noted, given that about 30% of all homes are owned free and clear, the amount of equity residing in the 70% of homes with a mortgage may well be in the single digits. (Data on actual equity remaining in mortgaged homes is not readily available, and would be subject to wide differences of opinion on actual market valuations.)
Broadly speaking, housing as the bedrock of middle class financial security has been either destroyed (no equity) or severely impaired (limited equity). The oversupply of homes on the market and in the “shadow inventory” of defaulted/foreclosed homes awaiting auction has also impaired the ability of homeowners to sell their property; in this sense, any remaining equity is trapped, as selling is difficult and equity extraction via HELOCs (home equity lines of credit) has, for all intents and purposes, vanished.
The Fed’s strategy, in conjunction with the government-owned and -operated mortgage agencies that own or guarantee the majority of mortgages in the US (Fannie Mae, Freddie Mac, FHA, and the VA), is to stabilize the housing market through subsidizing the cost of mortgage borrowing by shifting hundreds of billions of dollars out of savers’ earnings with ZIRP.
Since roughly 60% of households either already own a home or are ensnared in the default/foreclosure process, then the pool of buyers boils down to two classes: buyers who would be marginal if not for government subsidies and super-low mortgage rates, and investors seeking some sort of return above that of US Treasury bonds. The Fed has handed investors two choices to risk a return above inflation: equities (the stock market) or real estate. Given the uneven track record of stocks since the 2009 meltdown, it is not much of a surprise that investors large and small have been seeking “deals” in real estate as a way to earn a return.
Recent data from the National Association of Realtors concludes that cash buyers (a proxy for investors) accounted for 31% of homes sold in December 2011. Even in the pricey San Francisco Bay Area, where median prices are still in the $350,000 range, investors accounted for 27% of all sales. Absentee buyers (again, a proxy for investors) paid a median price of around $225,000, substantially lower than the general median price.
This data suggests that “bargain” properties are being snapped up for cash, either as rental properties or in hopes of “flipping” for a profit after some modest cleanup and repair.
There is one lingering problem with the Fed and the federal housing agencies’ concerted campaigns to punish capital accumulation, push investors into equities or real estate, and subsidize marginal buyers to boost sales at current valuations. The market cannot “discover” price or establish a risk premium when the government and its proxies are, in essence, the market.
By some accounts, literally 99% of all mortgages in the U.S. are government-issued or -guaranteed. If any other sector was so completely owned by the federal government, most people would concede that it was a socialized industry. Yet we in the US maintain the fiction of a “free market” in mortgages and housing.
To establish a truly free and transparent market for mortgages and housing, we would have to end all federal subsidies and guarantees/backstops, and restore the market as sole arbiter of interest rates — i.e., remove that control from the Federal Reserve.
Everyone with a stake in the current market fears such a return to an open market because it is likely that prices would plummet once government subsidies, guarantees, and incentives were removed. Yet without such an open market, buyers can never be certain that price and risk have truly been discovered. Buyers in today’s market may feel that the government has removed all risk from buying, but they might find that they “caught the falling knife;” that is, bought into a false bottom in a market that has yet to reach transparent price discovery.
So, the key question still remains for anyone who owns a home or is looking to soon own one…how close are we to the bottom in housing prices?
In Part II: Determining the Housing Bottom for Your Local Market, we tackle that question head-on. Because local dynamics inevitably play such a large role in determining fair pricing for any given market, instead of giving a simple forecast, we instead offer a portfolio of tools and other resources for analyzing home values on a local basis. Our goal is to empower readers to calculate an informed estimate of “fair value” for their own markets — and then see how closely current local real estate prices fit (or deviate) from it.
Click here to access Part II of this report (free executive summary, enrollment required for full access).
This article was originally published on chrismartenson.com.
 You don’t see